Visualising Voltage, Amplitude, and Frequency Relationships in 3D
We’re often stressing how a vibration motor’s voltage, vibration amplitude, and vibration frequency are interrelated – essentially the voltage controls the motor speed which in turn directly affects the frequency and amplitude, Application Bulletin 029 covers this in full.
Other factors help determine the profile for each motor, such as the size of the eccentric mass or the output torque from the motor’s internal construction. However, once the motor has been manufactured, it’s all controlled by varying the applied voltage and the amplitude/frequency relationship is set.
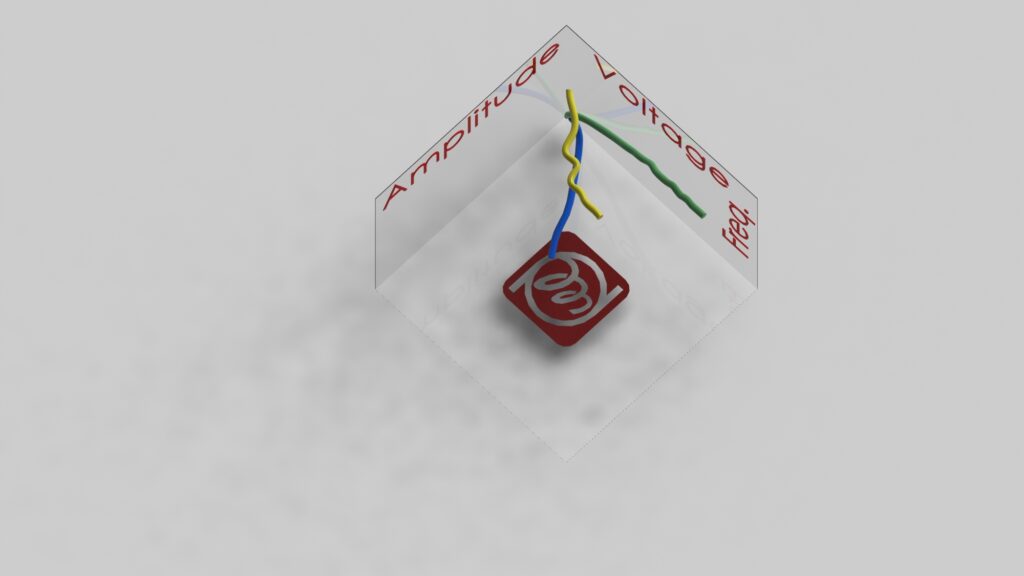
So to help visualise the relationships, we’ve created some pretty cool looking 3D graphs:
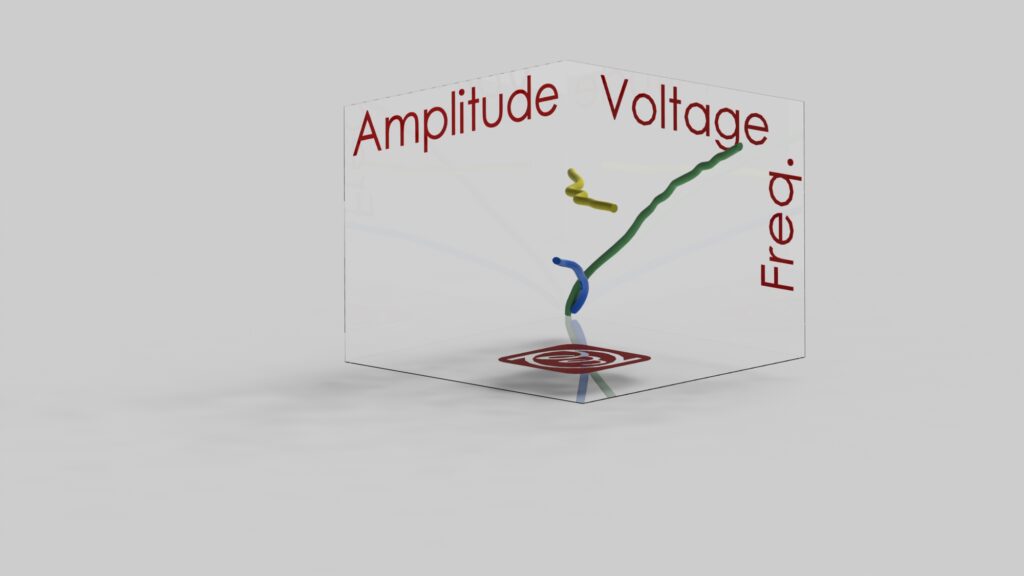
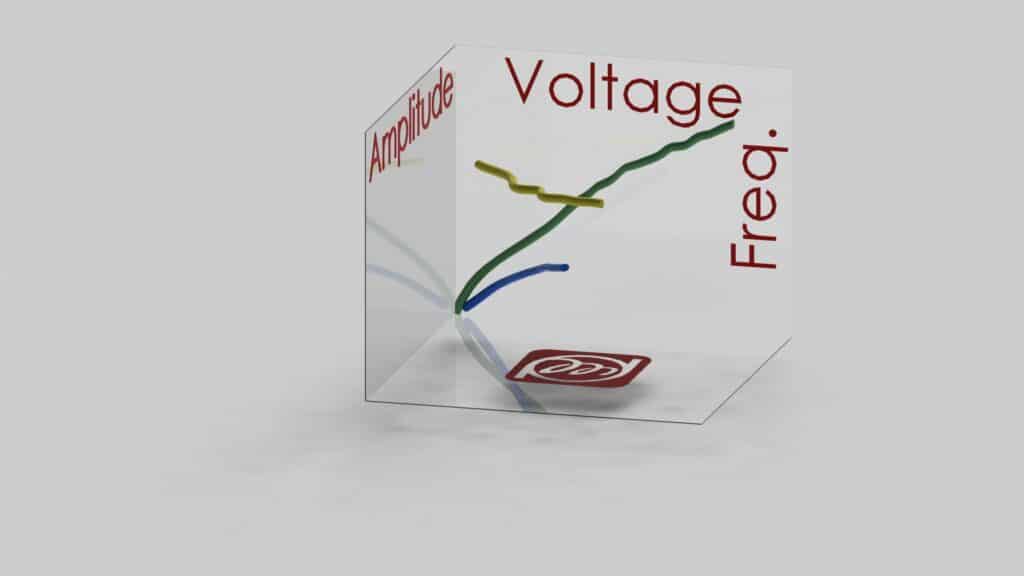
We have put the vibration amplitude on the X-axis, the voltage on the Y-axis, and the vibration frequency on the vertical Z-axis. The three graph lines represent the vibration profile of 3 different actuators:
- (Green) 304-103 – a 3V SMD ERM, with 0.5G Typical Normalised Amplitude
- (Blue) 307-001 – a powerful 1.5V ERM, with 1.7G Typical Normalised Amplitude
- (Yellow) C10-100 – a 2V RMS LRA, with 1.5G Typical Normalised Amplitude and 170 Hz Rated Resonant Frequency
The graphs make for pretty interesting reading. We should note that the wavey nature of the data sets are due to us sampling real test data, which hasn’t been smoothed out so there are some small variances in the results.
We can see how the amplitude of the two ERMs increase with applied voltage – and so too does the frequency. We can see that for a specific motor at a specific voltage, there is a single vibration amplitude and frequency. These cannot be varied independently.
Also, we see how the larger and more powerful 307-001 reaches a much higher vibration amplitude than the tiny 304-103 (~ 4 times), despite being rated at half the voltage. However, the 304-103 reaches a much higher frequency – this is because the motor has a very small eccentric mass and must turn much faster to produce a reasonable force.
Finally, we’ve included the C10-100 as a comparison between ERMs and LRAs. We see that there is no movement in the Frequency Z-axis, resulting from the LRAs only being driven at their resonant frequency. This means that the amplitude and frequency of the LRA are not directly related and the amplitude can be varied independently – however that frequency is fixed across all voltages.

Of course, this is the information we are all familiar with – having stressed it repeatedly! But the graph provides a pretty good visual aid that hopefully, even our long-standing subscribers find interesting!

Get in touch
Speak to a member of our team.
Motor catalogue
Looking for our products?
Reliable, cost-effective miniature mechanisms and motors that meet your application demands.
Discover more
Resources and guides
Discover our product application notes, design guides, news and case studies.
Case studies
Explore our collection of case studies, examples of our products in a range of applications.
Precision Microdrives
Whether you need a motor component, or a fully validated and tested complex mechanism – we’re here to help. Find out more about our company.