Testing a Vibration Motor with Vibration iPhone App
Introduction
Here at Precision Microdrives, our trendy iPhone-owning engineers recently stumbled upon the Vibration app, brought to you by Diffraction Limited Design LLC. This great piece of software uses the accelerometers of the iPhone to measure vibration amplitudes, also performing some pretty nifty maths including Hamming Windows and Fast Fourier Transforms on the way. Designed to replicate a spectrum analyser, the full version comes with a host of additional features for easy analysis.
So for some fun, we thought we would test one of our vibration motors with a “donated” iPhone and the Vibration app!
The Set-up
First, choosing the motor. The maximum sample rate for Vibration is 100 Hz, so ideally we would like a motor with a vibration frequency of less than 50 Hz (fs = 2 fh) at its rated voltage. So using our super simple search features, we can find vibration motors by a variety of details – including Rated Speed.
To convert our desired vibration frequency to RPM we multiply it by 60 (1 Hz is one rotation per second, which is 60 rotations per minute), so 50 Hz * 60 = 3000 RPM Max. Now looking only at motors with Rated Speeds of 2800 – 8400 RPM we can see only one motor meets that requirement, the 324-102.
However, with none available to use for a fun test, we decided to use the 312-202, a Uni Vibe 12mm vibrating motor, which has a rated speed of.4600 RPM (~77 Hz).
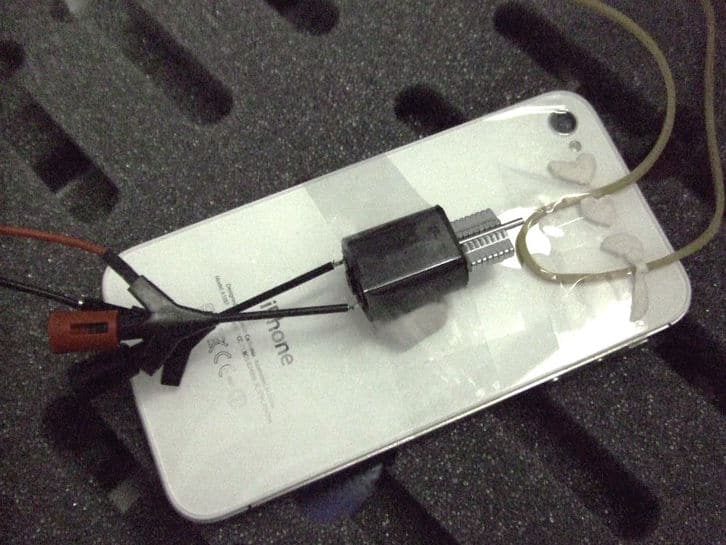
This may be where our test becomes less scientific! We have a plethora of fancy machines and gizmos for testing our motors, but the sleek and shiny iPhone isn’t really designed to house an external motor – as small as that motor may be. So with a bit of DIY and Sellotape, we attached our 312-202 to the back of the iPhone, here’s one we made earlier:

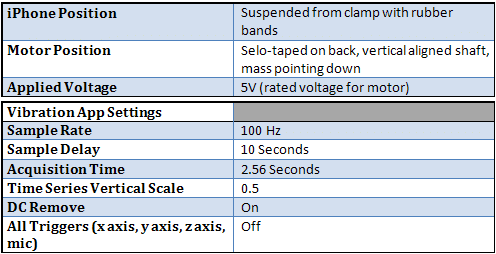
Hooking the motor up to our DC power supply, we ran the Vibration app. With the first few runs producing disappointing results, changed our “test suite” a couple of times until we finally settled on the following:

Results
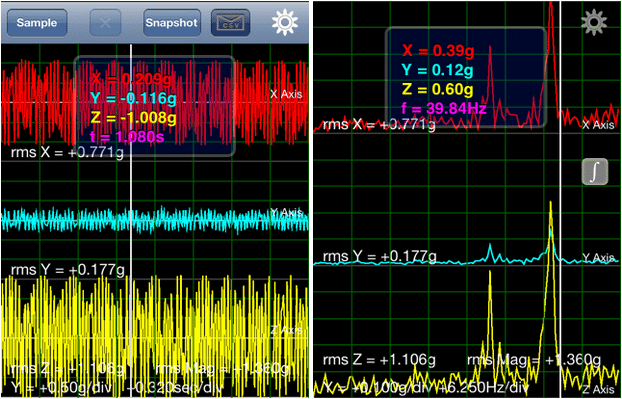
Using the app’s handy “email CSV” feature, my inbox beeps with the delivery of the CSV file containing the test results and the following screenshots:

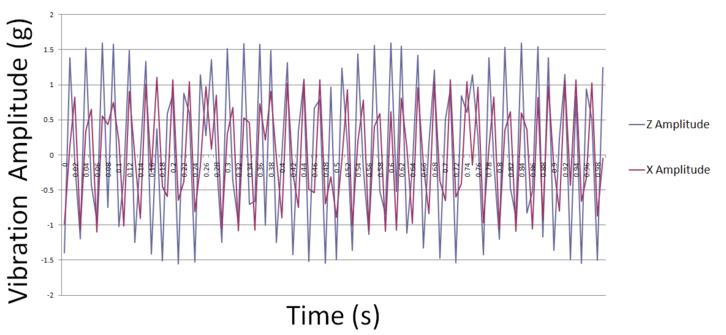
And this graph plots the results from the CSV file:

We only took interest in the X-axis (left and right movement) and Z-axis (towards and away from your movement) results because there was little movement in the Y-axis (vertical movement). You may notice the X-axis results and Z-axis results are in 180º out of phase. This represents a circular motion as the iPhone sways from the cradle as a result of the eccentric rotating mass. Although we took samples at 100 Hz for 2.56 seconds, we have only plotted over the period of 1 second (256 samples looked a bit messy). From the graph we can see the Z-axis returning a peak-to-peak vibration amplitude of 2 ~ 2.5 G. Comparing that to the Conformity Limits Specification of the 312-202, we can see the Minimum Vibration Amplitude as 1.4 G.
A pass! Or is it?
Well, it’s pretty close. You can see in the conditions of our in-house test, Minimum Vibration Amplitude is the “Peak-to-peak value at rated voltage using the inertial test load”. The Inertial Test Load is the mass of the sled used in our Vibration Sled Test, which is 250g, and the iPhone weighs 140g. So we would expect the Minimum Vibration Amplitude to be higher than 1.4 G, actually, it should be ~2 G. Why? In the past we’ve found that around this weight the vibration amplitude should be proportional to the inertial load, so a 44% decrease in test load (250g -> 140g) should be matched with a 44% increase in vibration amplitude (1.4 G -> 2 G).
Looking at our 312-202’s Typical Vibration Amplitude, accounting for the decrease in inertial load, we would around 2.9 G. So why do the numbers differ, I hear you say. Good question, you hear me say. Well as we’ve already mentioned, there are a few problems with our setup:
- Our chosen motor, 312-202, has a vibration frequency of ~77 Hz, which is above half the 100 Hz sampling rate.
- The iPhone has the motor Sellotaped to its back! This could dampen the vibration from the motor.
- The iPhone’s accelerometer is not designed for the type of tests we run in-house.
Some of the values in the datasheet are “Typical Characteristics”, the behaviour of individual motors may vary.
A Conclusion?
We’re impressed! Given how crude our setup was, we experienced similar results to what we would expect. Perhaps with more time, we could have taken a closer look and really put it through its paces. But for a ‘ballpark figure,’ it’s great, we would recommend it for all you vibration analysis enthusiasts.

Get in touch
Speak to a member of our team.
Motor catalogue
Looking for our products?
Reliable, cost-effective miniature mechanisms and motors that meet your application demands.
Discover more
Resources and guides
Discover our product application notes, design guides, news and case studies.
Case studies
Explore our collection of case studies, examples of our products in a range of applications.
Precision Microdrives
Whether you need a motor component, or a fully validated and tested complex mechanism – we’re here to help. Find out more about our company.