High performance Linear Resonant Actuators (LRAs) for demanding haptic feedback applications.
Our Linear Resonant Actuator (LRA) vibration motors are used in handheld or body worn devices, for vibration alerting and haptic feedback functions. In combination with a suitable driver, they offer precise haptic feedback effects with a long lifetime of operation.
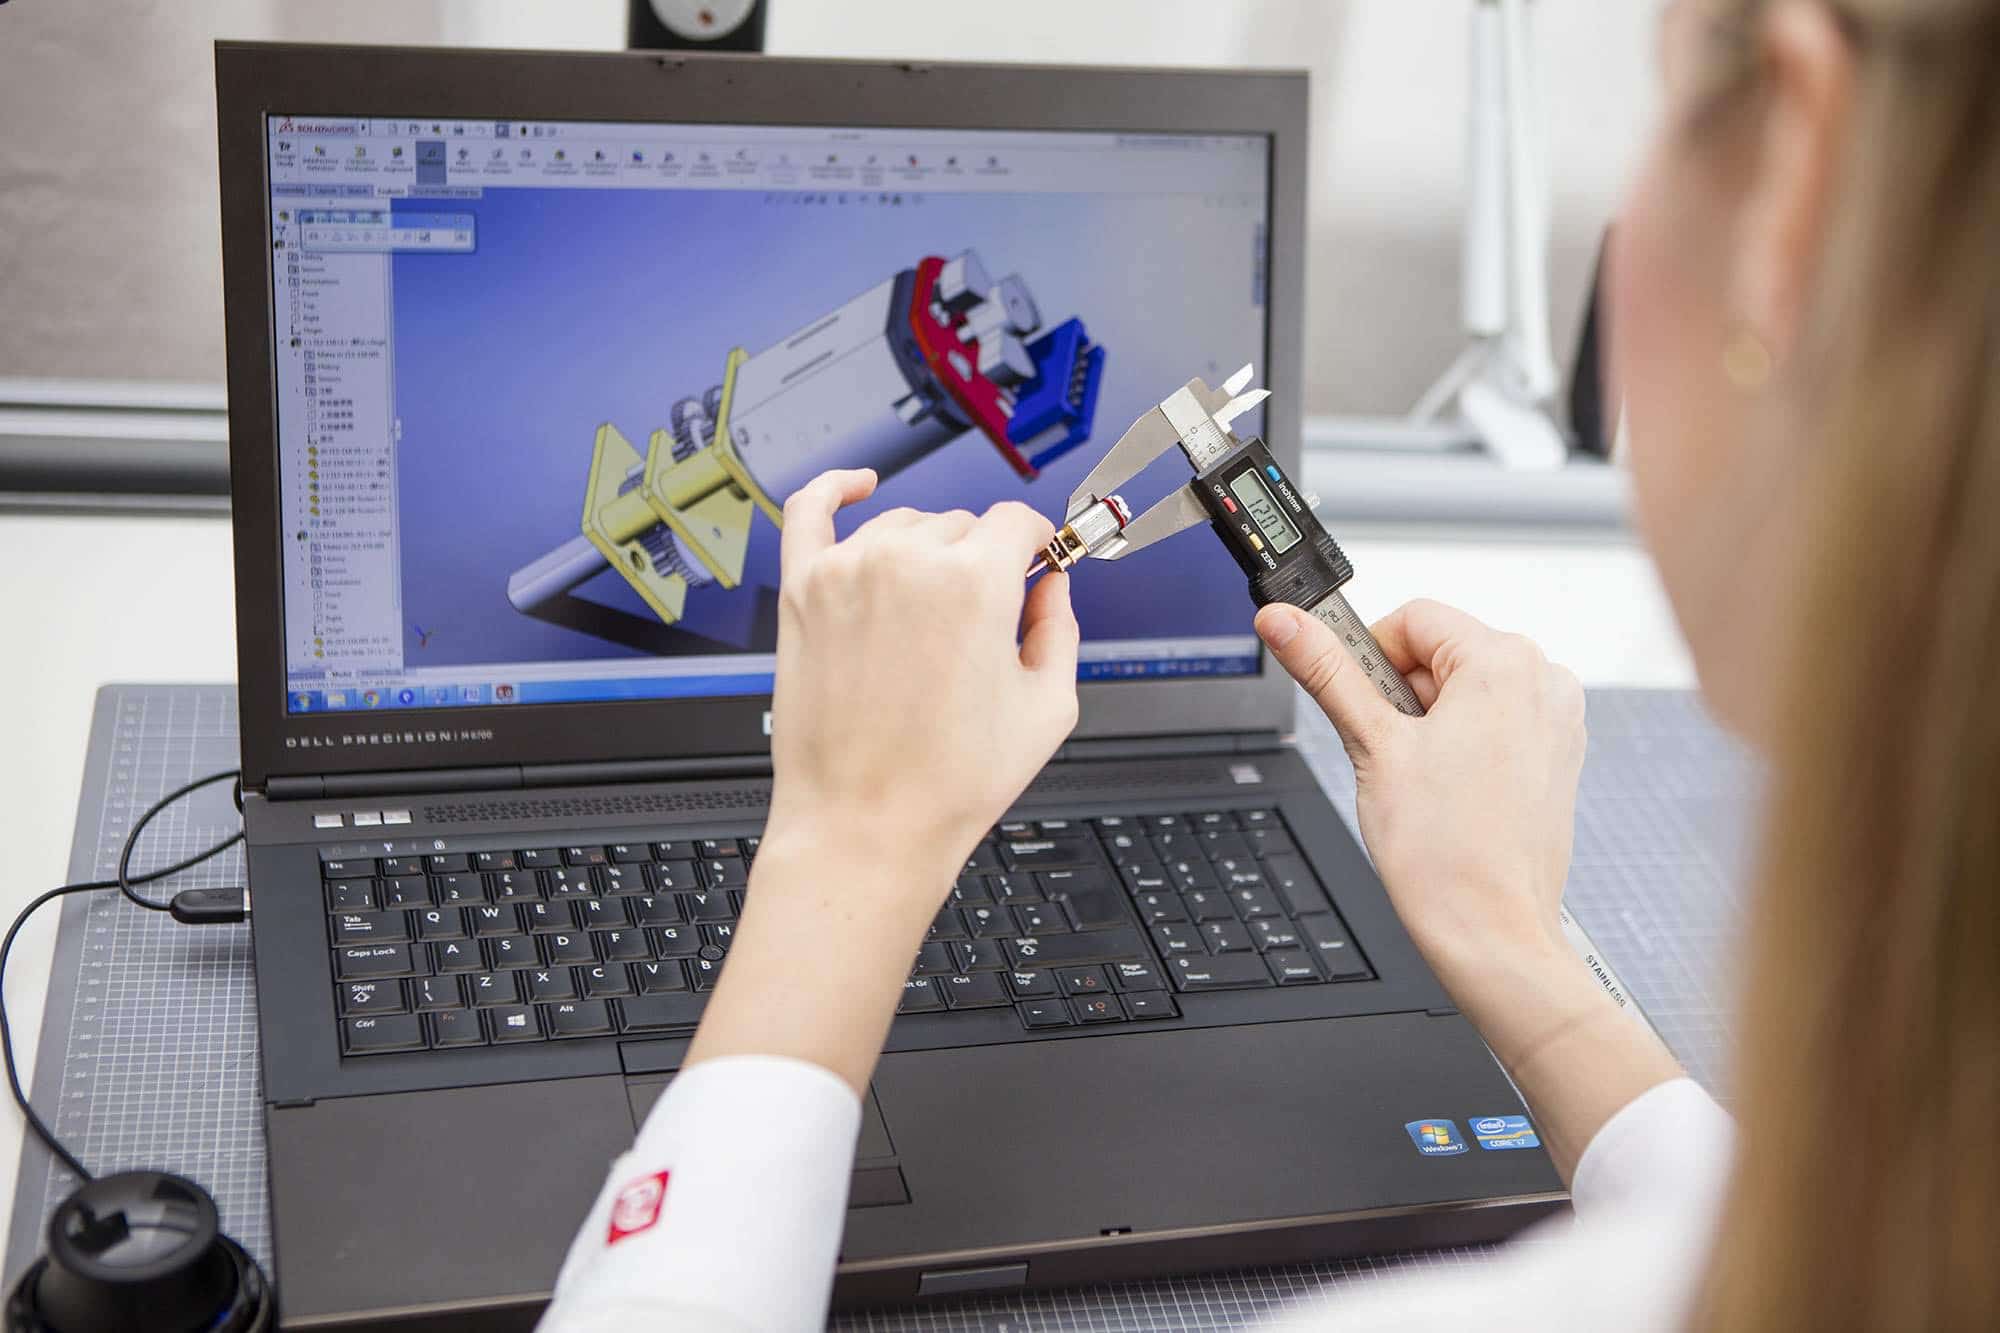
We are trusted experts in the design and development of LRA vibration motors for a wide range of consumer and industrial applications. Contact us for free development support and advice!
4 products in this category
| C08-005 | 8mm Coin LRA | 276 | Stocked design | Y-axis | 8 | 3.2 | 1.28 | 235 | 100 mm x AWG32 | 1.5 | 0.61 | 1.85 | 0.5 | 102 | -25 | 70 | 21 | 113 | 0.17 | 75 | 12 | 33 | 123 | ||
| C08-00A | 8mm Coin LRA | 622 | Stocked design | Y-axis | 8 | 2.6 | 0.7 | 240 | 100 mm x AWG34 | 1.5 | 0.42 | 1.25 | 0.4 | 41 | -20 | 70 | 32.6 | 0.74 | 0.26 | 28 | 12 | 27 | 83 | ||
| C10-100 | 10mm Coin LRA | 4,073 | Stocked design | Y-axis | 10 | 3.7 | 1.5 | 175 | 100 mm x AWG32 | 1.5 | 1 | 2.05 | 0.5 | 90 | -25 | 70 | 24.4 | 0.085 | 0.16 | 67 | 11 | 37 | 177 | ||
| C12-003 | 12mm Block LRA | 0 | 8 weeks | Z-axis | 12 | 2.8 | 1.5 | 204 | 100 mm x AWG32 | 1.5 | 0.9 | 2.05 | 0.5 | 149 | -25 | 70 | 15.7 | 0.065 | 0.27 | 111 | 10 | 32 | 125 |
Using LRAs is straight forward, but they require special drive signals to function.
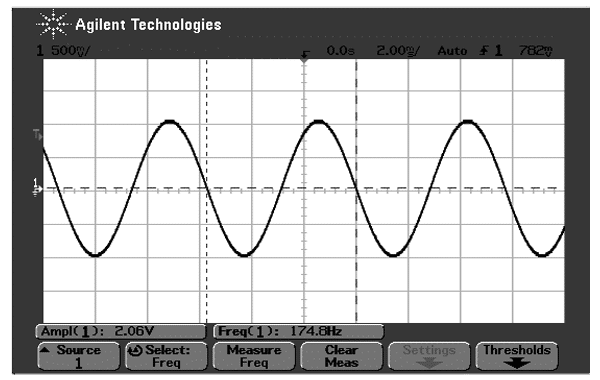
LRA linear vibrators need to be driven with an AC signal, much like a loudspeaker. It is preferable that this signal is a sinewave at the resonant frequency as shown below. Off the shelf driver ICs (such as the DRV2605), which come with integrated haptic feedback patterns, make this task easy.
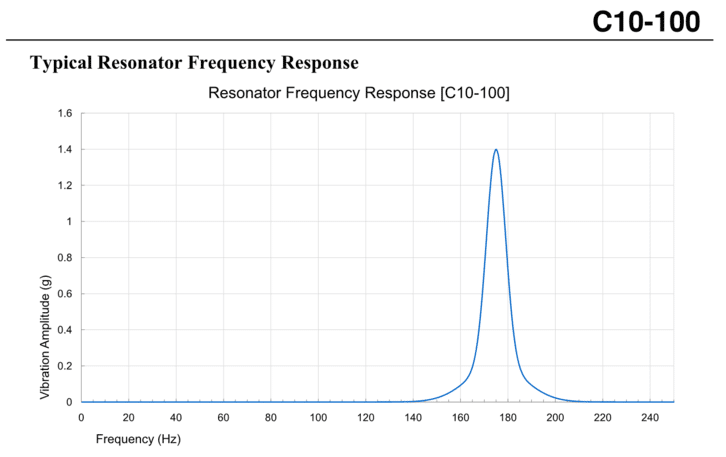
LRA vibration motors have a frequency of resonance. The combination of spring stiffness, mass and magnet / coil size, as well as other parameters will dictate the frequency response as shown below. LRA drivers will auto-tune to the resonance point to maximise vibration output.
You need our support. We're here to help.
Motor products are difficult to understand, specify, validate and integrate into end application. The industry has no standards and suppliers typically offer only fragments of advice.
We know what you don't and can mitigate your motor design, manufacturing and supply risks.
Get in touch with our team today.
LRA vibration motors are effectively brushless as they use a voice-coil to drive the mass. This means that the only moving parts that are prone to failure are the springs. These springs are modelled with finite element analysis (FEA) and are operated within their non-fatigue zone.
With little mechanical wear (within normal operating limits), failure modes are restricted to ageing of internal components, which results in much longer MTTF failure modes than traditional brushed eccentric rotating mass (ERM) vibration motors.
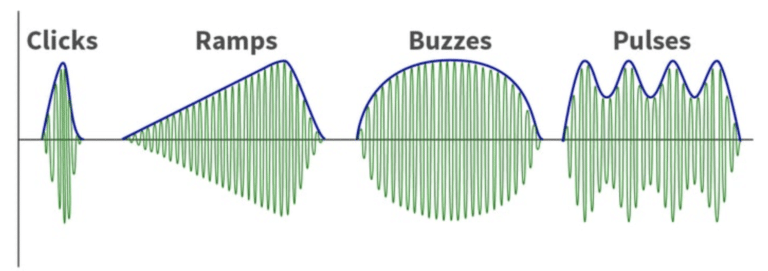
Some LRA driver IC’s come with built-in haptic feedback processors, which modulate the sinusoidal vibration to create haptic effects. Below is an example of haptic effects, and how they would be visualised on an oscilloscope.
Our Linear Resonant Actuator (LRA) vibration motors are used in handheld or body worn devices, for vibration alerting and haptic feedback functions. In combination with a suitable driver, they offer precise haptic feedback effects with a long lifetime of operation.
We are trusted experts in the design and development of LRA vibration motors for a wide range of consumer and industrial applications. Contact us for free development support and advice!
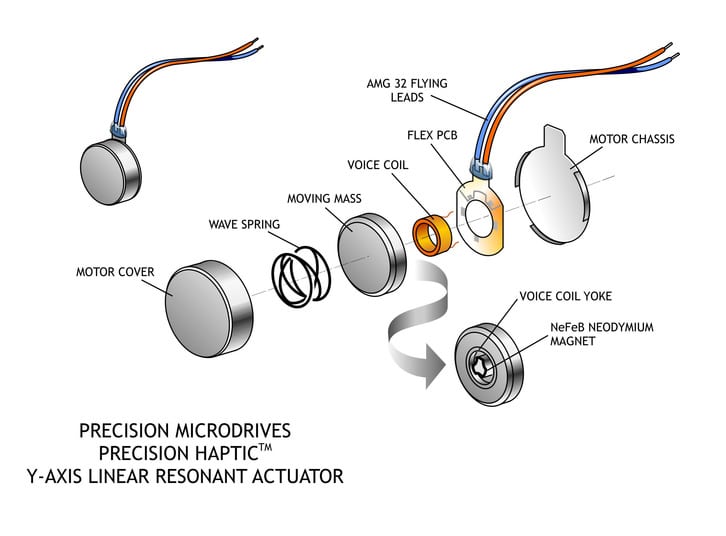
The coin LRA motor is very reminiscent of a loud speaker in design, except that the cone and surround, is replaced with a spring and mass. Vibration goes in and out of the surface onto which the LRA is affixed.
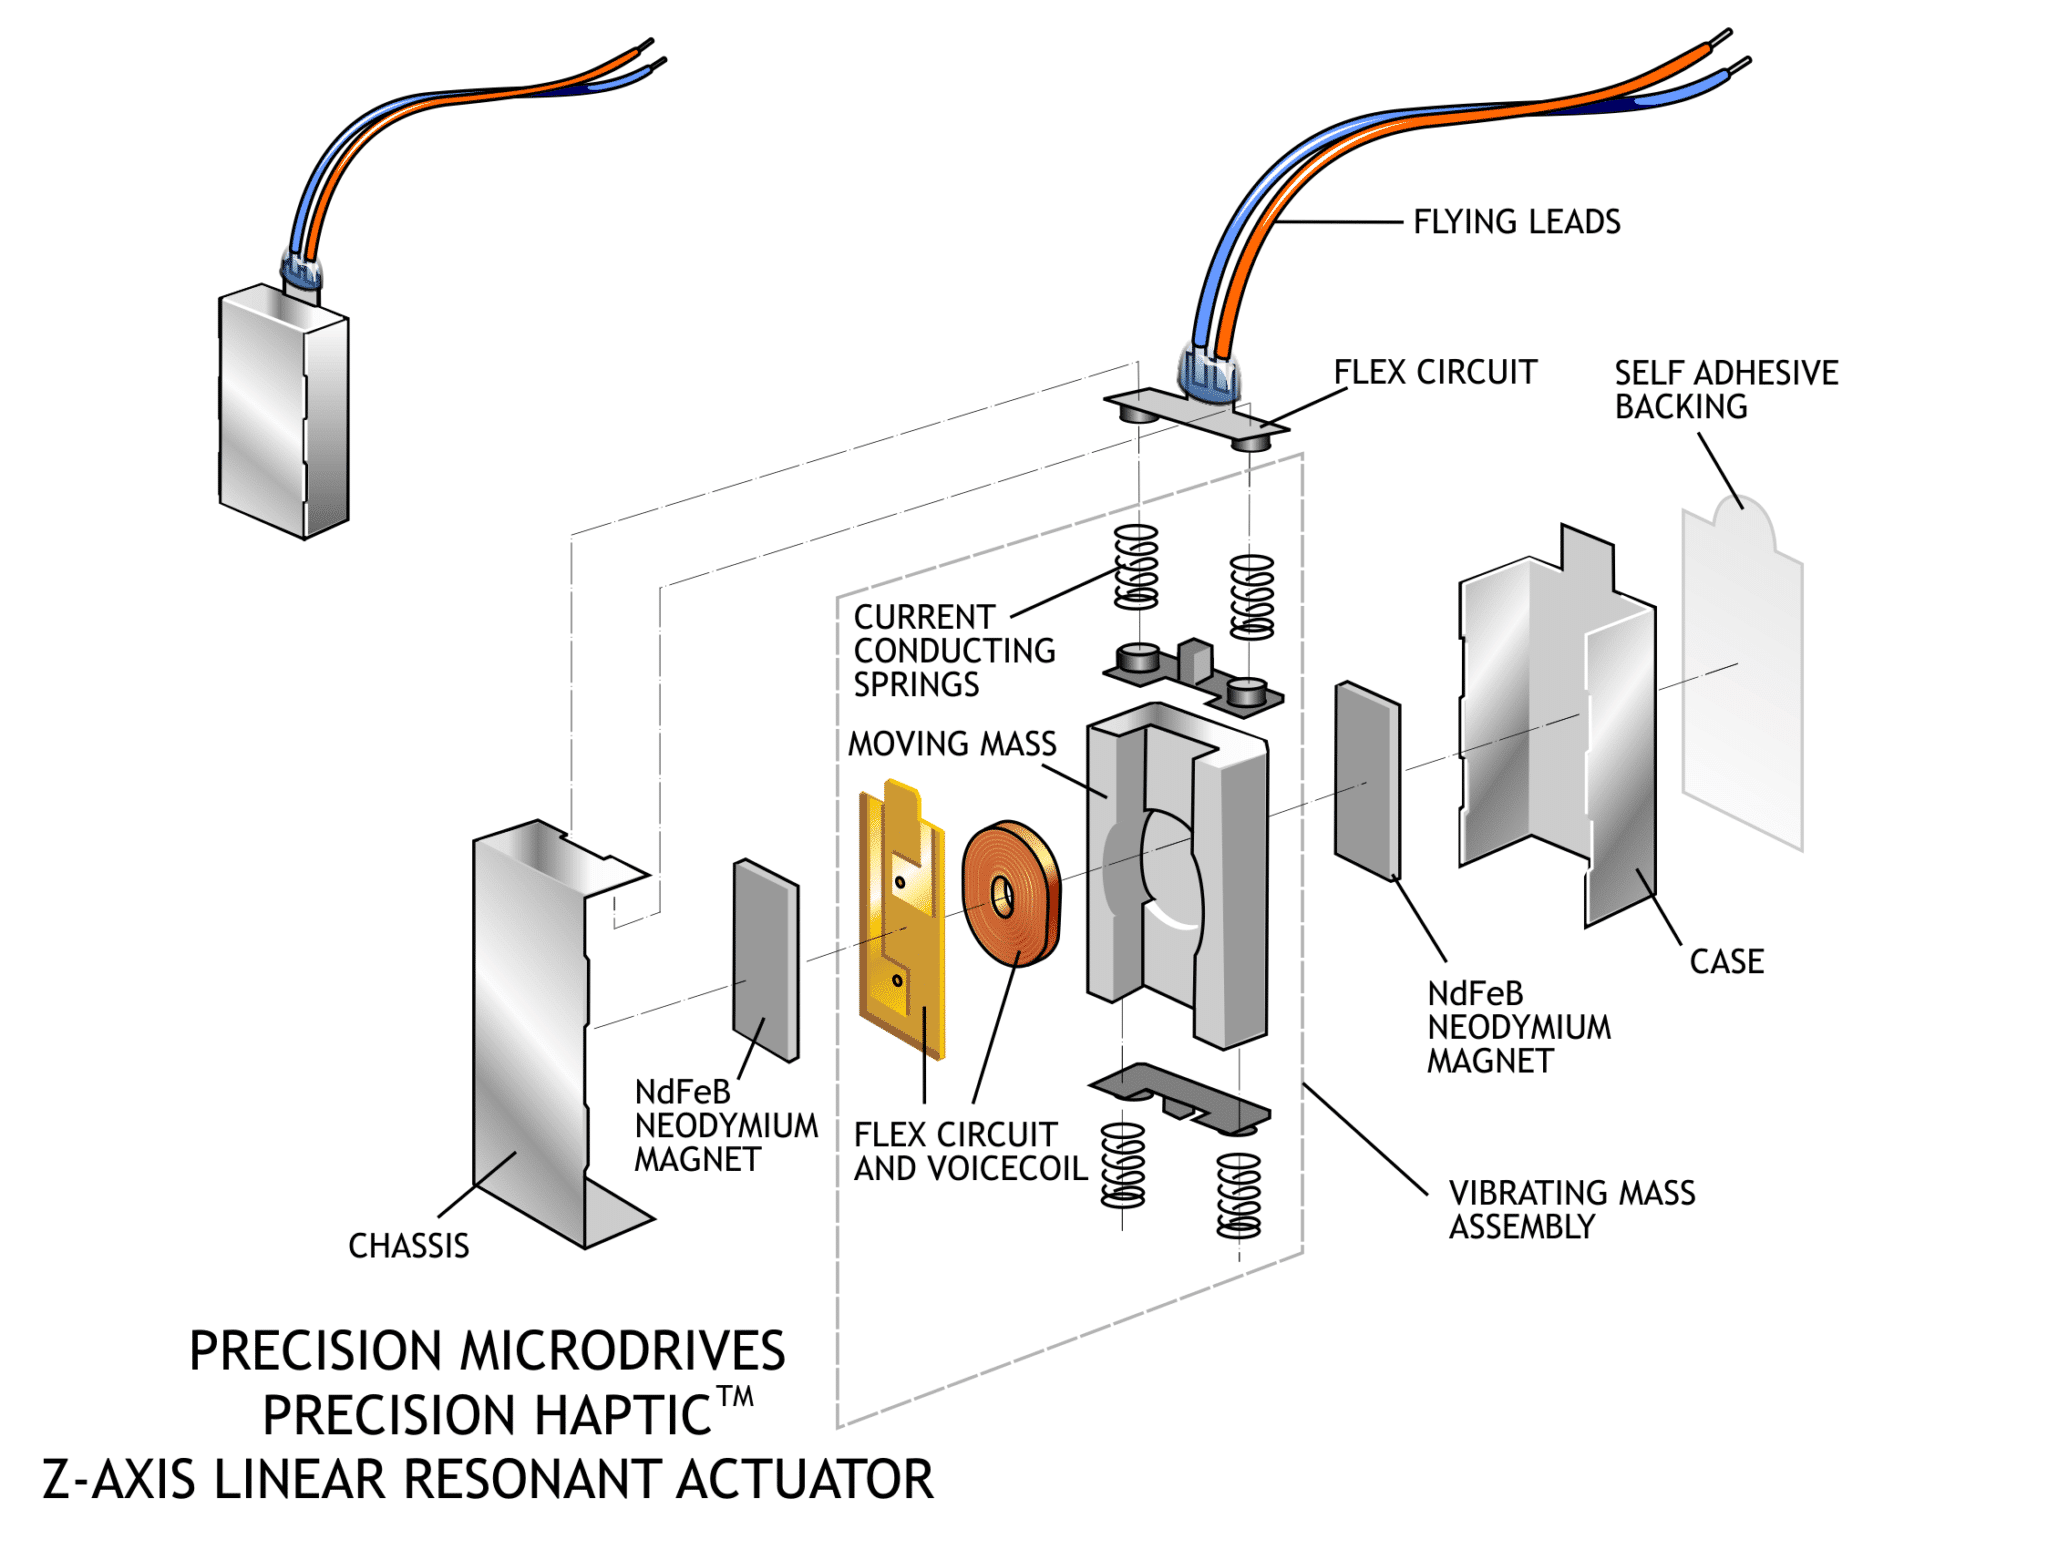
The block LRA motor is more reminiscent of a solenoid rotated onto its side, also with a sprung mass. Vibration in this case, is side to side relative to the surface onto which the LRA is affixed.
Precision mechanisms
We use our proven technology to solve your motor problems, reducing costs and managing your risk through optimised design.