New Testing for the Precision Haptic™ ERMs
Looking for our Haptics range? View our main Haptics hub here.
As promised in December, our Precision Haptic™ range now includes three ERMs in addition to the two existing LRAs.
In this blog post, we are explaining the new graph that appears on the datasheets for the 5 mm 305-000 (since depreciated), 6mm 306-109, and the 8mm 308-102 ERM vibration motors. The tests here are equivalent to the tests performed by Immersions in their TS2000 Actuator Performance Test.
Step Response
The Step Response is performed on all our vibration motors to obtain the Haptic Characteristics values. For the Precision Haptic™ range we generate the graph too. It’s not the exact same test, as we measure a couple of different values. There’s more on this at the very bottom of this post.
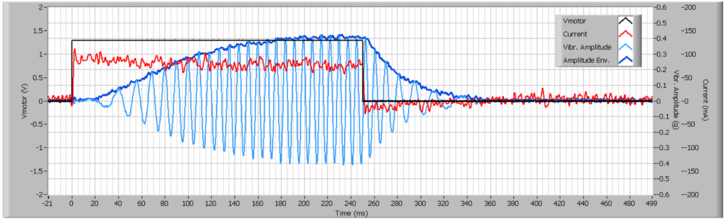
Here the premise is fairly simple and relates to how motors are normally driven in many different applications. The motor is switched on until it reaches its maximum vibration amplitude, then switched off.
From the graph for the 305-000 you can see powered with its Rated Voltage (1.3 V) at T = 0. After around 180 ms the vibration amplitude is at its maximum amplitude of 0.4 G. Once the system is sure it has reached a steady-state, the input voltage is returned to 0 V at T ~ 250 ms.
We measure the vibration amplitude and the current draw throughout the test until the motor has reached its rest state.
Overdrive Step Response
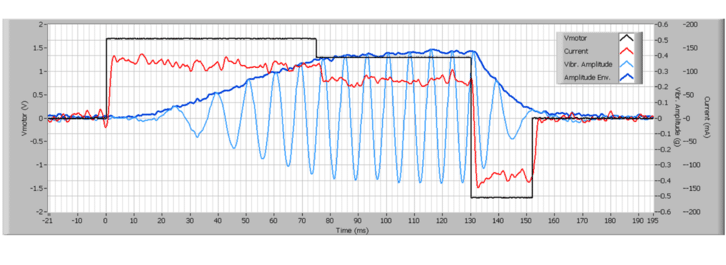
This test is designed to take the motor through a similar cycle – from rest to full vibration amplitude, then return to rest. However, in this instance, we use a couple of haptic feedback driving techniques to improve the performance.
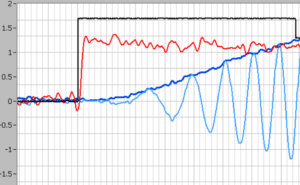
First, we use Overdrive to start the motor quicker. This involves applying the motor’s Maximum Operating Voltage instead of the Rated Voltage, for the 305-000 this is 1.7 V. Once the motor reaches 90% of its rated amplitude the voltage is reduced to the Rated Voltage (to avoid damaging the motor).
The speed of a DC motor is determined by the amount of torque it can exert, which directly relates to the level of current through the armature. We increase the current by increasing the applied voltage, in turn, this increases the available torque and causes the motor to turn faster.
To stop the motor, instead of setting the drive voltage to 0 V and letting it come to rest (as with the Step Response test) we use the technique of Active Braking. Once the motor is in steady-state at full vibration amplitude (T ~ 130 ms) we again apply the Maximum Rated Voltage, but this time with the polarity reversed, i.e. -1.7 V.
By reversing the voltage, the flow of current is reversed and which causes the force in the magnetic field to act in the opposite direction.
Measurements and Results
The measurements from the haptic tests are listed in the tables above the graphs. There are also a couple of questions that might arise answered below but if you have any more please contact us.
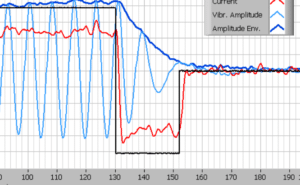
Why does the active brake signal stop before the vibration amplitude reaches zero?
The length of the Active Brake needs to be carefully calculated as if it is too short the motor will take longer to stop. Whereas if applied for too long the motor will begin to turn in the opposite direction. This is the maximum amount of time we experienced without overshooting.
Why does the vibration envelope show 0.4 G when the Typical Normalised Amplitude is 0.8 G?
The values for vibration amplitude used in our Typical Performance Characteristics graph and throughout the datasheets and website are peak-to-peak measurements. You can see from the haptic testing graphs the vibration amplitude varies from +0.4 G to -0.4 G, that’s 0.8 G total.
Vibration Frequency
It is possible to calculate the vibration frequency from the graph, and it shows how it relates to the speed of the motor.
As an example, we can use the Overdrive Step Response graph and take a full wave cycle at the negative peaks at T = 112 ms to T = 120 ms (roughly). That means there is one cycle every 8ms, giving a frequency of:
$$f = \frac{1}{0.008} = 125Hz$$
That’s 125 cycles every second, or:
$$Motor \: Speed \: (RPM) = f(Hz) \times 60 = 7,500RPM$$
Which happens to be the rated speed of the 305-000.
Why does the Typical Brake Time on page 9 differ from the Typical Haptic Characteristics table on page 3?
The table Typical Haptic Characteristics on page 3 is an older test, carried out on all of our vibration motors and LRAs. Here this test was taken under different specifications where the motor was driven to steady-state at its Maximum Operating Voltage, then had the Active Brake signal applied. The new test applies with the motor in steady-state at its Rated Voltage.
As the motor turns faster at the Maximum Operating Voltage, the older test takes a little longer to drive the motor to stop than the newer TS2000 based tests on page 9. We’re planning to update the wording in the datasheets to highlight the difference soon.

Get in touch
Speak to a member of our team.
Motor catalogue
Looking for our products?
Reliable, cost-effective miniature mechanisms and motors that meet your application demands.
Newsletter
Sign up to receive new blogs, case studies and resources – directly to your inbox.

Sign up
Discover more
Resources and guides
Discover our product application notes, design guides, news and case studies.
Case studies
Explore our collection of case studies, examples of our products in a range of applications.
Precision Microdrives
Whether you need a motor component, or a fully validated and tested complex mechanism – we’re here to help. Find out more about our company.