AB-019
Lifetime Of DC Vibration Motors
Overview
Reliability is an important consideration for engineers and product designers. It is also very context specific. For example consider a car, which is made from lots of individual components. If the radio antenna should fail, the car still operates, however, this is not the case if the engine stops working. Some features are more important than others, especially with safety systems such as the car’s brakes.
In relation to vibration motors and their typical applications, we can consider them as individual components or entire systems. Haptic feedback on a user interface is comprised of the input system (such as a touchscreen), the microcontroller, the motor drive circuit, and the vibration motor. If any one of these should fail, then the vibration feature will no longer work.
As with any component, our vibration motors will eventually stop working. The key, therefore, is accurately estimating when and determining if it is an acceptable period of time. To do this, we can use one of a number of different methods for calculating the probability of a component’s life expectancy.
Below we discuss the main causes of failure, some statistical approaches to determining motor lifetime, and offer a ‘real-life’ example using one of our ERM vibration motors.

Get in touch
Speak to a member of our team.
Motor catalogue
Looking for our products?
Reliable, cost-effective miniature mechanisms and motors that meet your application demands.
Main Causes Of Failure With Vibration Motors
Of course, it’s not just the vibration motor that can fail, but the drive circuitry can also stop working. As we explained in the introduction, it can depend on where you draw the boundary of the system. If you are using a motor drive IC that fails, the vibration motor could still be operational, but as a feature, the vibration effect no longer works.
Other external factors include control signal failure, improper mounting or enclosure impeding the rotation of the eccentric mass, or power source issues.
As a motor manufacturer, our focus remains on the vibrating motor part of such systems, and although we do recommend driver IC’s and mounting methods, we’ll only be covering longevity issues related of the motor itself.
Typically vibration motors will fail in one of two ways:
- Overheating (rarely)
This will either cause shorting as the wire lacquer disintegrates and fails to insulate or cause the winding connected to the commutator to break as the solder melts.
- Mechanical Wear (more common)
The precious metal brushes and copper commutator are subject to mechanical wear, this debris and particles can fill the gaps between the commutator segments and cause the motor to short. In extreme cases of wear, the brush can snap off, losing the connection altogether (open circuit).
The H-bridge is a more complex drive configuration that makes use of four transistors; two pMOS for the high-side of the circuit and two nMOS for the low-side. These can be in the form of a single package that contains all the transistors and diodes, or if board-space is available, it can often be made cheaper with discrete components.
Normal brushed motors (like vibration motors) can be operated in ‘four quadrants’, in other words, they have four modes of operation: forward drive, reverse braking, reverse drive and forward braking. In the case of haptic feedback, we’re going to ignore the ‘braking’ quadrants, and drive the motor either in forward drive to initiate vibration, or when we want to stop the vibration quickly (at the end of the haptic event), reverse drive the motor long enough to make it stop.
Measuring Failure Rates
Mean Time To Failure (MTTF)
The MTTF assumes the component cannot be repaired or serviced and is a variation of the common Mean Time Between Failure (MTBF) figure, which assumes the component can be repaired. MTTF is more applicable to miniature vibration motors because they’re generally too fragile and small to be repaired.
The formula that defines the MTTF is:
$latex MTTF \approx \frac{Total \: Time}{Number \: Of \: Failures} $
𝑇𝑜𝑡𝑎𝑙𝑇𝑖𝑚𝑒 can use any unit of time desired, although we will stick with hours as they are the most common. It includes all the motors that were still operational at the end of the test, plus the time that the failed motors ran for before dying. This gives us the total successful hours and when divided by the number of failures, we have the Mean Time To Failure.
However, this can lead to artificially high numbers, especially when testing a large quantity of vibration motors for shorter time periods. As an example, say we tested 1000 motors for 1000 hours. Only 10 of the motors failed, all after completing 900 hours. The MTTF would be calculated as follows:
$latex MTTF \approx \frac{Total \: Time}{Number \: Of \: Failures} $
𝑀𝑇𝑇𝐹≈(9,990∗1,000)+(900∗10)10
𝑀𝑇𝑇𝐹≈9,999,00010
𝑀𝑇𝑇𝐹≈999,900ℎ𝑜𝑢𝑟𝑠
No DC motor would run for 999,900 hours, that’s over 114 years!
In fact, for every additional vibration motor that runs the entire course, the MTTF is increased by the length of the test divided by the number of failures. In the above example, that’s 100 hours for every additional motor tested.
With MTTF there is an element of uncertainty when the sample number is low or when the failure number is low. MTTF can become much more accurate if the test period is long enough such that every vibration motor under test fails. Unfortunately, that would take a very long time to complete and most companies have limited resources to dedicate to testing. Instead, there are other statistical calculations we can do that are designed to improve the reliability of calculations.
Failures In Time (FIT)
The FIT rate shows how many failures can be expected from one billion hours of operation. It effectively presents the MTTF in a different format. These two numbers express the same failure rate, it simply depends on what you are more familiar with or if you are required to use one figure in further analysis. The FIT is calculated as follows:𝐹𝐼𝑇=1,000,000,000𝑀𝑇𝑇𝐹
Using the numbers we used for the MTTF example:𝐹𝐼𝑇=1,000,000,000999,900𝐹𝐼𝑇≈1000
We can see that FIT depends upon the reliability of the MTTF, which means it is subject to the same misrepresentation.
Weibull Analysis
Weibull Analysis helps improve the accuracy of MTTF and FIT rates for vibrating motors when there are small sample sizes or a low failure rate from the test. It is based around the ‘Weibull distribution’, which is a probability density function. This sounds complicated, but it’s fairly simple to understand.
If we are testing a motor over a period of time, we do not know when (or if) the motor will fail. In probability terms, the time at which a motor will fail is known as a ‘continuous random variable’. It is a variable because it will change for each motor and random because we cannot predict or calculate when that specific motor will fail.
A probability density function is a way of representing the probability of the continuous random variable having a specific value. In our example, the probability density function shows when the motor is most likely to fail (and therefore when it is least likely to fail). It is often shown as a graph, with the failure rate on the vertical axis and a unit of measurement on the horizontal axis (in our case – time):
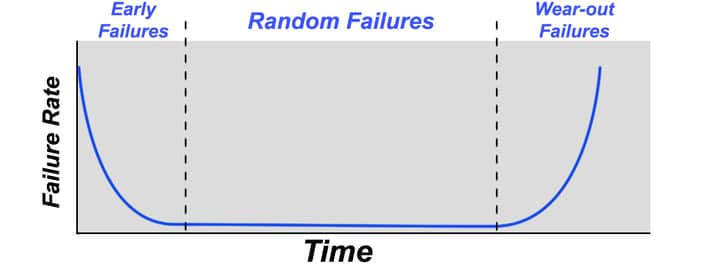
The above graph is known as the ‘bathtub curve’. It is a common probability distribution showing that for certain devices, some will fail at the very start of their lives or after a length of time when they will start to wear out.
The Weibull analysis uses some fairly complicated maths, which is beyond the scope of this Application Bulletin. However, we will explain its process. The Weibull analysis takes your test data and attempts to model it so it fits a Weibull distribution. It does this by finding two distribution parameters, eta and beta. Then, with appropriate values for eta() and beta(
) they are used to calculate a new MTTF, and subsequently a new FIT rate.
An Example Case – 307-001 Pico Vibe™
The Setup
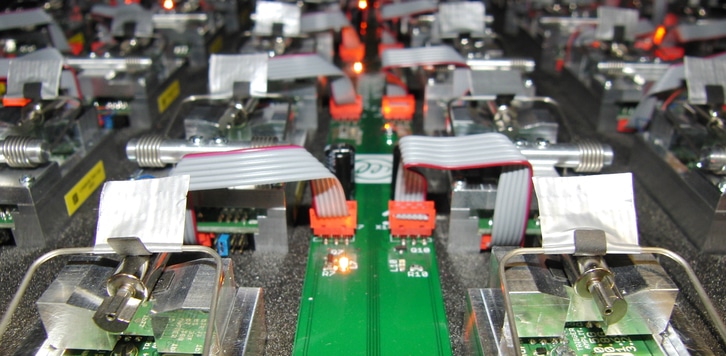
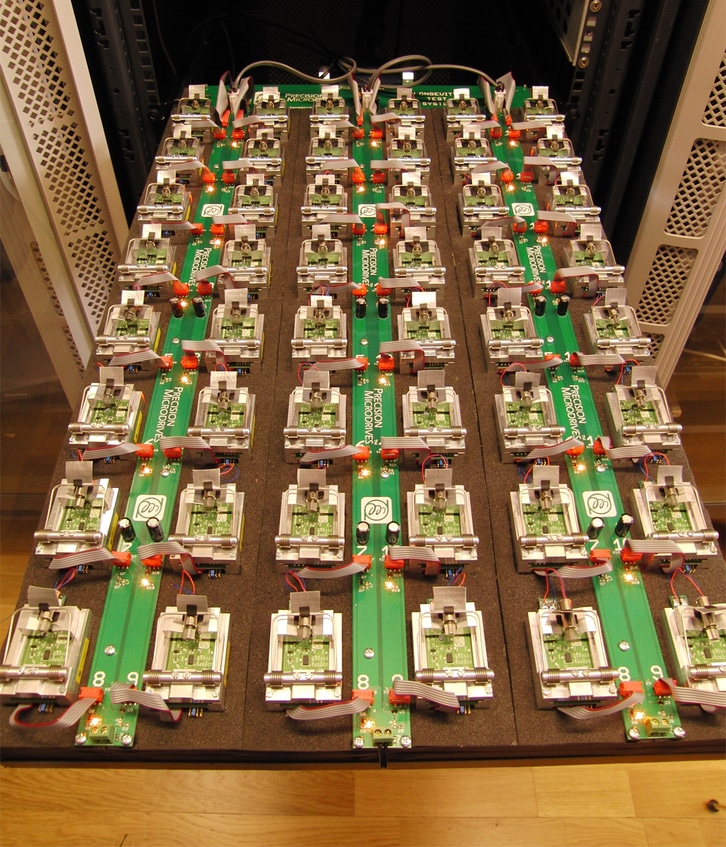
Our vibration motor longevity test machine
With our custom longevity test machine, we are able to test multiple vibrations motors in a variety of test situations, including duration and drive sequence. From the output, we are not only able to see which vibration motors failed, but we can pinpoint the exact time.
We mounted 43 units of the Pico Vibe™ 307-001 into individual vibration sleds for testing. Half of the motors were driven on for two seconds while the other half stayed off. They then swapped as the first half switched off and the second half vibrated for two seconds. This ‘2 seconds on – 2 seconds off’ drive sequence was repeated for 2 months, 1440 hours for each vibration motor.
The machine would detect a motor had failed through the accelerometer attached to each vibration sled. The time of failure (accurate to within 4 seconds) was then registered and presented in the summary at the end of testing.
The Data
From our longevity machine’s report, we were able to see that all of the vibration motors except 6 were still operational after the 1440 hour test period.
The failure times were as follows:
| Motor Failure # | Time (h) | Total Successful Hours from Failed Motors (h) |
| 1 | 860 | 860 |
| 2 | 912 | 1772 |
| 3 | 921 | 2693 |
| 4 | 1168 | 3861 |
| 5 | 1273 | 5134 |
| 6 | 1388 | 6522 |
The failed motors accumulated 6,522 hours of successful operation. The other 37 vibration motors that were still operational amassed 53,280 hours (1440 x 37). This gave a total of 59,802 operational hours from 43 units under test.
Now we can re-calculate the MTTF and FIT as per their definitions. First, Mean Time To Failure:𝑀𝑇𝑇𝐹≈𝑇𝑜𝑡𝑎𝑙𝑇𝑖𝑚𝑒𝑁𝑜.𝑜𝑓𝐹𝑎𝑖𝑙𝑢𝑟𝑒𝑠𝑀𝑇𝑇𝐹≈6,522+53,2806𝑀𝑇𝑇𝐹≈59,8026𝑀𝑇𝑇𝐹≈9967ℎ𝑜𝑢𝑟𝑠
Remember, Failure In Time rate is the amount of devices that would fail during one billion hours of operation:𝐹𝐼𝑇=1,000,000,000𝑀𝑇𝑇𝐹𝐹𝐼𝑇=1,000,000,0009967𝐹𝐼𝑇≈100,331
These results are not realistic because our test returned a very small failure rate. As explained above, we can make our results more representative by using Weibull analysis. Our estimated values for eta( 𝜂 ) and beta( 𝛽 ) are:𝜂=2000𝛽=4.4
Next we use these parameters to calculate our new mean time to failure and failures in time rates:𝑀𝑇𝑇𝐹≈1822.77ℎ𝑜𝑢𝑟𝑠𝐹𝐼𝑇≈548,615
Discussion Of Results
From our initial calculation of MTTF and FIT we can see the problem with having a low failure rate. The original MTTF estimate predicted that our motors would run for over a year, this would be extremely unlikely for any brushed DC electrical motor.
Our Weibull analysis produces much more realistic results. A further important point to take away is that our vibration motors like any DC motor fit a Weibull distribution. A common mistake is for customers to read the MTTF figure and assume that their motor will fail ‘around this time’. If that was the case, the motor failure rate would have ‘normal probability distribution’:
Vibration motor failures do not follow this distribution. They follow the bathtub curve as mentioned earlier. If one of our vibration motors has an MTTF of 2000 hours on the datasheet, it does not mean that if you purchase one it will “last around 2000 hours”. Instead, you should interpret the figure as if you buy 1000 you will receive approximately two million operational hours.
Conclusion
We have explained how failure rates are calculated, highlighting their drawbacks and explaining what the figures mean. For this, we first looked at the Mean Time To Failure and Failure in Time rates.
When using small sample sizes or if we have low failure rates calculate the MTTF and FIT differently by using Weibull analysis. This allows us to provide our customers with more reliable data on the lifetime of vibration motors.
Using the testing of our 307-001 we demonstrated the process we use in-house for generating the MTTF that we’re starting to provide in our datasheets.
We’re in the process of determining MTTF figures for several key products in our range and are the only vibration motor manufacturer to do so. As figures are calculated they will be added to their respective datasheets.
Discover more
Resources and guides
Discover our product application notes, design guides, news and case studies.
Case studies
Explore our collection of case studies, examples of our products in a range of applications.
Precision Microdrives
Whether you need a motor component, or a fully validated and tested complex mechanism – we’re here to help. Find out more about our company.